
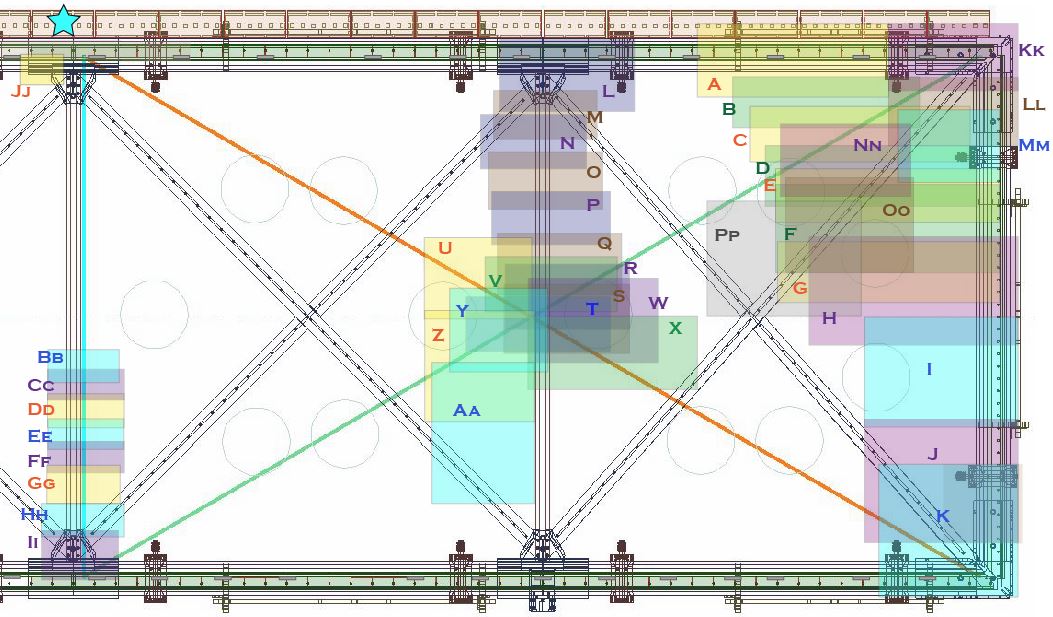
A 2015 survey took many photos at specific locations, adjusting the focus among photos at a single location. Shaded areas identified by Capital Letters show where these groups of photos were taken. The photo numbers in each group are collected in the table; clicking on a photo number will bring up that photo. The shaded areas show the approximate photo coverage area but most photos are rotated relative to these rectangles; an attempt is also made to convey the overlap between adjacent photo groups. The blue star shows the approximate location of the mirror and camera. The light green line represents a V-plane wire angle, and the tan line represents a U-plane wire angle.
The photos are high res – about half a MB each – and may take a few seconds to download. Images are mirror-flipped and then rotated so the image has an orientation similar to the diagram; some brightening and sharpening enhancements were applied to some photos.
| Group | Photos in this Group | |||||||||||
|---|---|---|---|---|---|---|---|---|---|---|---|---|
| A | 276 | 277 | 278 | 279 | 280 | 281 | 282 | 283 | ||||
| B | 284 | 285 | 286 | 287 | ||||||||
| C | 288 | 289 | 290 | 291 | 292 | 293 | 294 | 295 | ||||
| D | 296 | 297 | 298 | 299 | 300 | 301 | ||||||
| E | 302 | 303 | 304 | 305 | 306 | 307 | ||||||
| F | 308 | 309 | 310 | 311 | 312 | 313 | 314 | 315 | 316 | 317 | 318 | 319 |
| G | 320 | 321 | 322 | 323 | 324 | |||||||
| H | 325 | 326 | 327 | |||||||||
| I | 328 | 329 | 330 | 331 | 332 | 333 | 334 | |||||
| J | 335 | 336 | 337 | 338 | 339 | 340 | ||||||
| K | 341 | 342 | 343 | 344 | 345 | 346 | 347 | |||||
| L | 348 | 349 | 350 | 351 | 352 | 353 | 354 | 355 | ||||
| M | 356 | 357 | 358 | 359 | 360 | |||||||
| N | 362 | 363 | 364 | 365 | 366 | 367 | ||||||
| O | 368 | 369 | 370 | 371 | 372 | 373 | 374 | |||||
| P | 375 | 376 | 377 | 378 | 379 | 380 | 381 | 382 | 383 | |||
| Q | 384 | 385 | 386 | 387 | ||||||||
| R | 388 | 389 | 390 | 391 | 392 | 393 | 394 | 395 | 407 | 408 | ||
| S | 396 | 397 | 398 | 399 | 400 | 401 | ||||||
| T | 402 | 403 | ||||||||||
| U | 404 | |||||||||||
| V | 405 | 406 | ||||||||||
| W | 409 | 410 | ||||||||||
| X | 411 | 412 | ||||||||||
| Y | 413 | 414 | 415 | 416 | 417 | 418 | ||||||
| Z | 419 | 420 | 421 | 422 | 423 | |||||||
| AA | 424 | 425 | 426 | 427 | ||||||||
| BB | 428 | 429 | 430 | |||||||||
| CC | 431 | 432 | 433 | |||||||||
| DD | 434 | 435 | ||||||||||
| ED | 436 | 437 | ||||||||||
| FF | 438 | 439 | 440 | |||||||||
| Gg | 441 | 442 | 443 | |||||||||
| HH | 444 | 445 | 446 | |||||||||
| II | 447 | 448 | 449 | 450 | 451 | 452 | 453 | 454 | 455 | 456 | 457 | |
| JJ | 458 | 459 | 460 | 461 | 462 | 463 | 464 | 465 | 466 | 467 | ||
| KK | 468 | 469 | ||||||||||
| LL | 470 | 471 | 472 | |||||||||
| MM | 473 | 474 | 475 | 476 | 477 | 478 | 479 | |||||
| NN | 480 | 481 | 482 | 483 | ||||||||
| OO | 484 | 485 | 486 | 487 | 488 | |||||||
| PP | 489 | 490 | 491 | |||||||||