
MicroBooNE Insignia and Logos
kalekologo_noshadow

kalekologo_noshadow.png
kalekologo_noshadow_caption.txt
The famous ‘Blue Swoosh’ MicroBooNE insignia. Also available with shadow text removed.
Public Plots from the SBN Physics Proposal
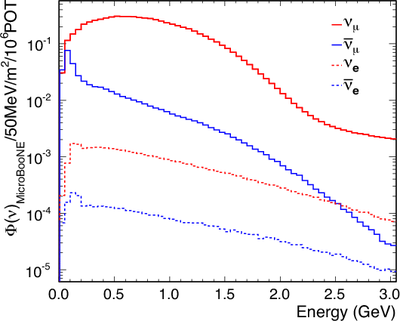
BNB_flux_uboone
BNB_flux_uboone.pdf BNB_flux_uboone_caption.txt
The Booster Neutrino Beam flux at MicroBooNE.
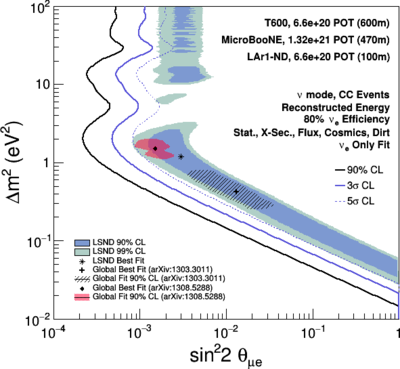
ND_100m_uB_T600_onaxis_nue_appearance_
ecalo2_nu_vePhot0_05_gap3_lessCosmics_xsec_0_flux_6_dirt_cos_sensPlot
ND_100m_uB_T600_onaxis_nue_appearance_ecalo2_nu_vePhot0_05_gap3_lessCosmics_xsec_0_flux_6_dirt_cos_sensPlot.png
ND_100m_uB_T600_onaxis_nue_appearance_ecalo2_nu_vePhot0_05_gap3_lessCosmics_xsec_0_flux_6_dirt_cos_sensPlot_caption.txt
Sensitivity of the SBN Program to $\nu_{\mu} \rightarrow \nu_{e}$ oscillation signals. All backgrounds and systematic uncertainties described in the proposal are included. The sensitivity shown corresponds to the event distributions, which includes the topological cuts on cosmic backgrounds and an additional 95% rejection factor coming from an external cosmic tagging system and internal light collection system to reject cosmic rays arriving at the detector in time with the beam.
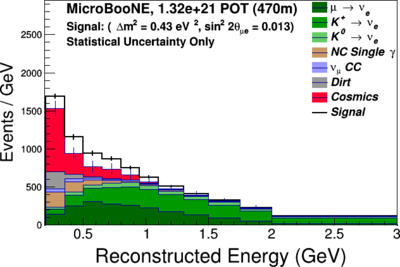
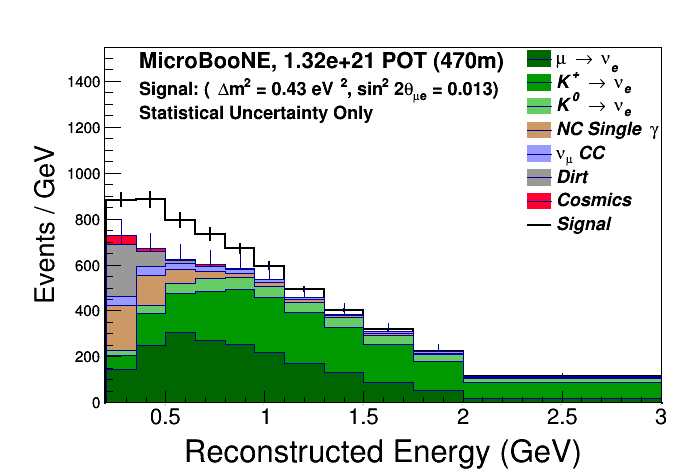
Nue_appearance_
ecalo2_nu_vePhot0_05_gap3_fullCosmics_470m_globBF
Nue_appearance_ecalo2_nu_vePhot0_05_gap3_fullCosmics_470m_globBF.png
Nue_appearance_ecalo2_nu_vePhot0_05_gap3_fullCosmics_470m_globBF_caption.txt
Electron neutrino charged-current candidate distributions in MicroBooNE shown as a function of reconstructed neutrino energy. All backgrounds are shown, only muon proximity and $\sfrac{dE}{dx}$ cuts have been used to reject cosmogenic background sources. Oscillation signal events for the best-fit 3+1 oscillation parameters from Kopp et al. (JHEP 1305, 050 (2013), arXiv:1303.3011) are indicated by the white histogram on top in each distribution. $\nu_{e}$ events have an assumed reconstruction efficiency of 80\%, and mis-identification from photons is taken at 6\% of events passing a topological cut. The topological cut assumes that photons with more than 50MeV of energy and a displaced vertex more than 3cm away will be reject.
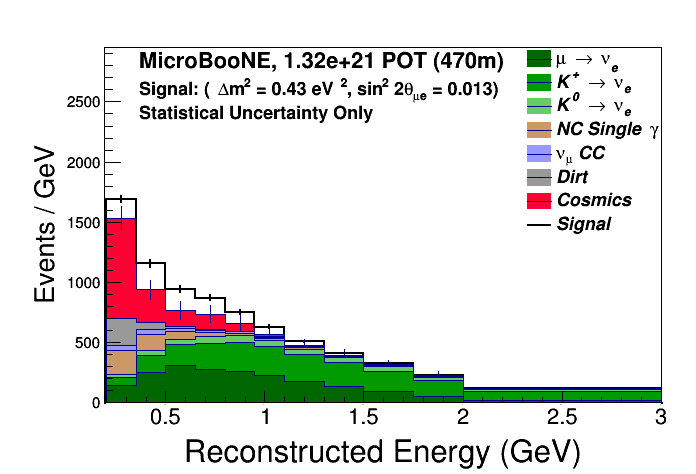
Nue_appearance_
ecalo2_nu_vePhot0_05_gap3_lessCosmics_470m_globBF
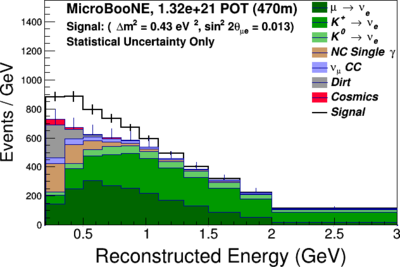
Nue_appearance_ecalo2_nu_vePhot0_05_gap3_lessCosmics_470m_globBF.png
Nue_appearance_ecalo2_nu_vePhot0_05_gap3_lessCosmics_470m_globBF_caption.txt
Electron neutrino charged-current candidate distributions in MicroBooNE shown as a function of reconstructed neutrino energy. All backgrounds are shown. For cosmicgenically induced events muon proximity, $\sfrac{dE}{dx}$ cuts, and a combination of the internal light collection systems and external cosmic tagger systems at each detector are assumed to conservatively identify 95% of the triggers with a cosmic muon in the beam spill time and those events are used to reject events. Oscillation signal events for the best-fit 3+1 oscillation parameters from Kopp et al. (JHEP 1305, 050 (2013), arXiv:1303.3011) are indicated by the white histogram on top in each distribution. $\nu_{e}$ events have an assumed reconstruction efficiency of 80\%, and mis-identification from photons is taken at 6\% of events passing a topological cut. The topological cut assumes that photons with more than 50 MeV of energy and a displaced vertex more than 3cm away will be reject.
Nue_sensitivity_compare_program
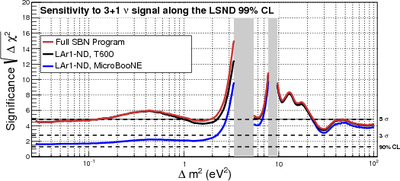
Nue_sensitivity_compare_program.pdf
Nue_sensitivity_compare_program_caption.txt
Sensitivity comparisons for $\nu_{\mu} \rightarrow \nu_e$ oscillations including all backgrounds and systematic uncertainties described in the proposal assuming 6.6e20 protons on target in LAr1-ND and the ICARUS-T600 and 13.2e20 protons on target in MicroBooNE. The three curves present the significance of coverage of the LSND 99% allowed region (above) for the three different possible combinations of SBN detectors: LAr1-ND and MicroBooNE only (blue), LAr1-ND and ICARUS only (black), and all three detectors (red).
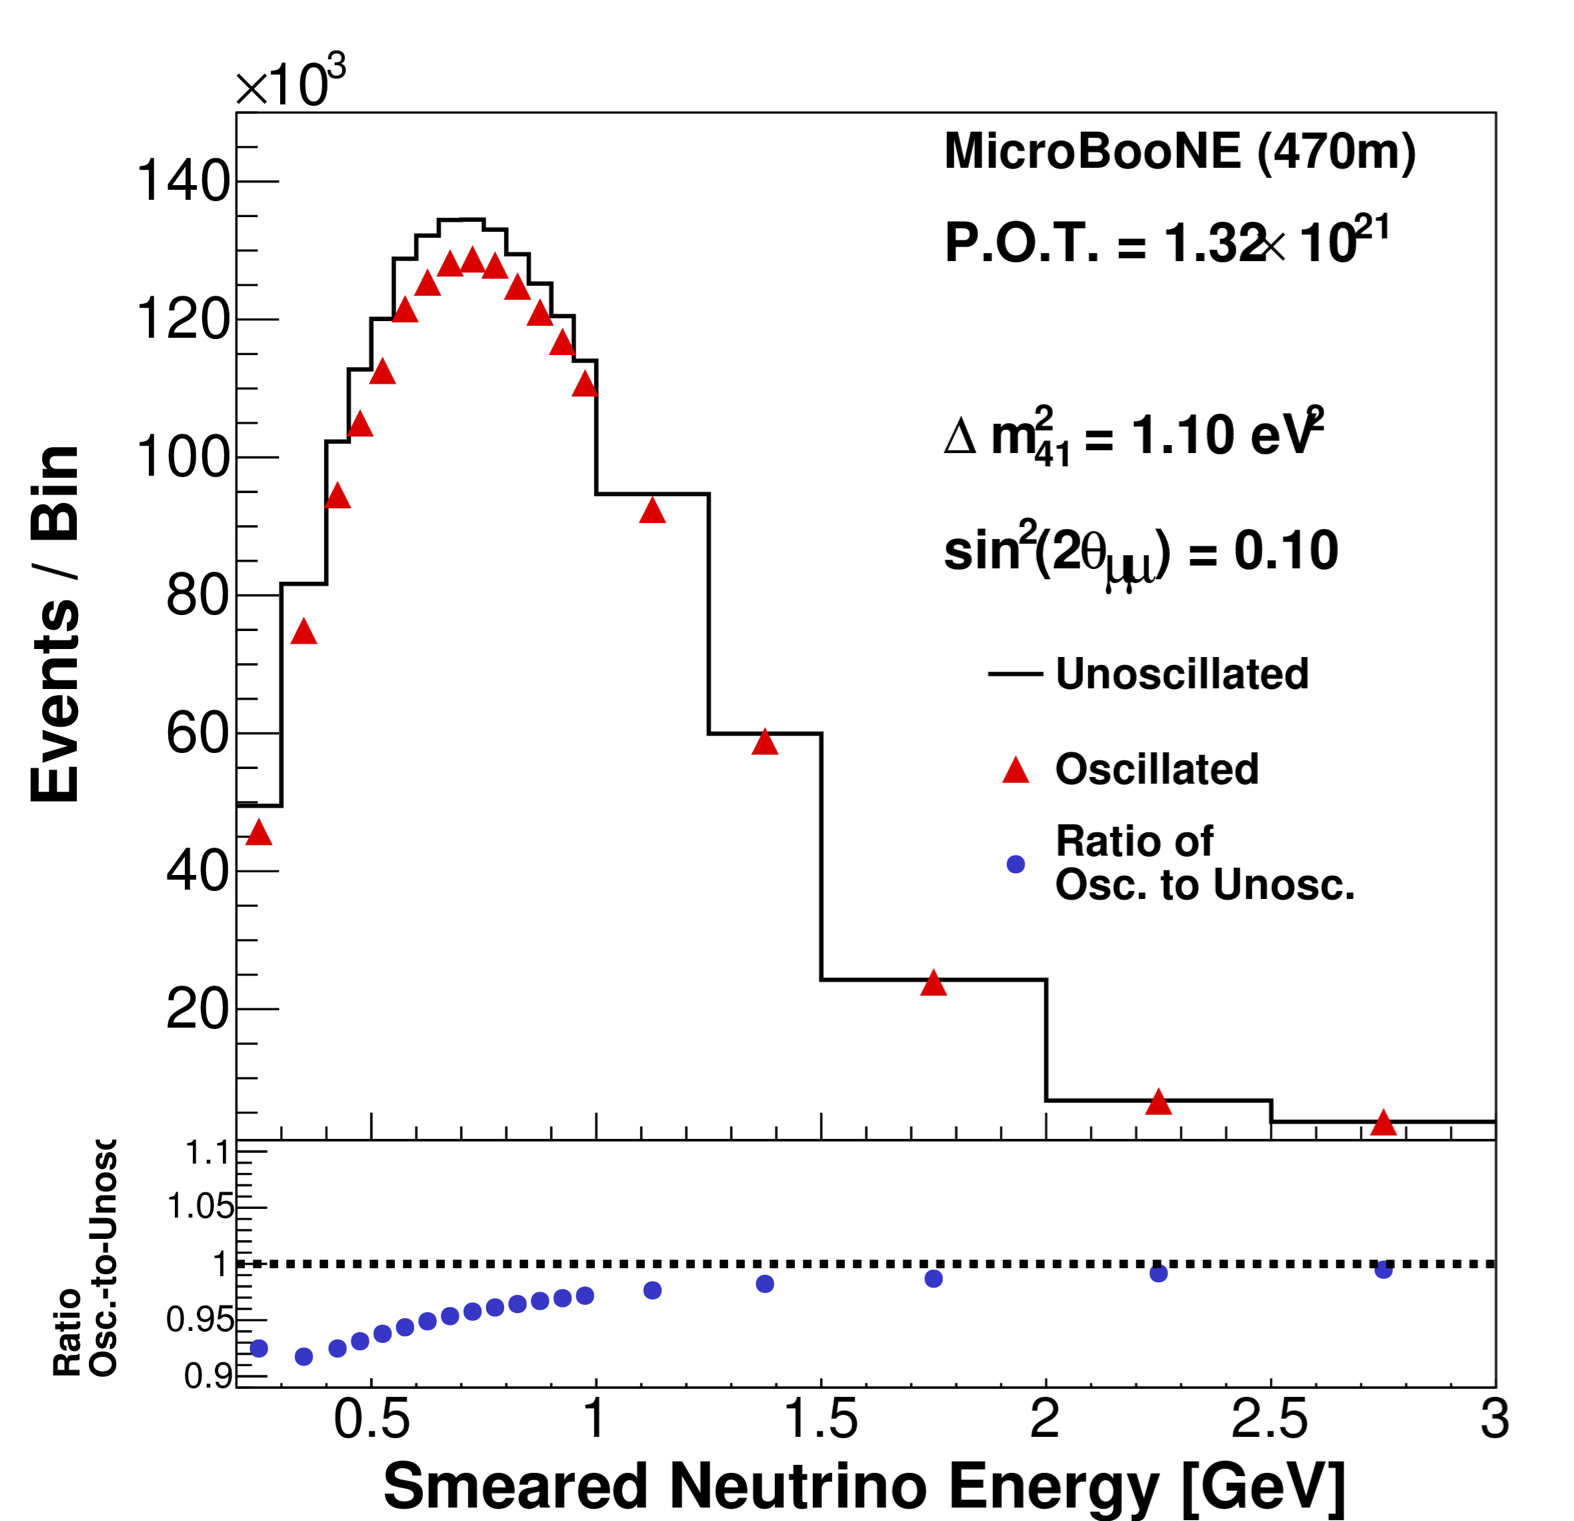
Numu_Evt_Dis_470m_1
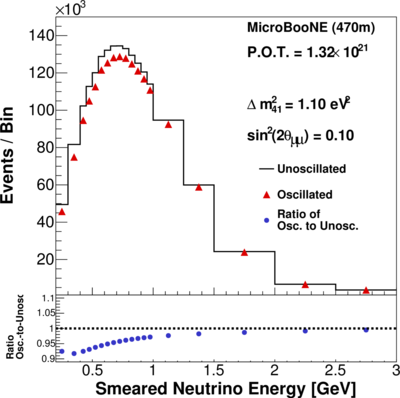
Numu_Evt_Dis_470m_1.png
Numu_Evt_Dis_470m_1_caption.txt
Examples of $\nu_{\mu}$ disappearance signals in MicroBooNE for $\Delta m^{2} = 1 \text{eV}^2$ with 13.2e20 protons on target.
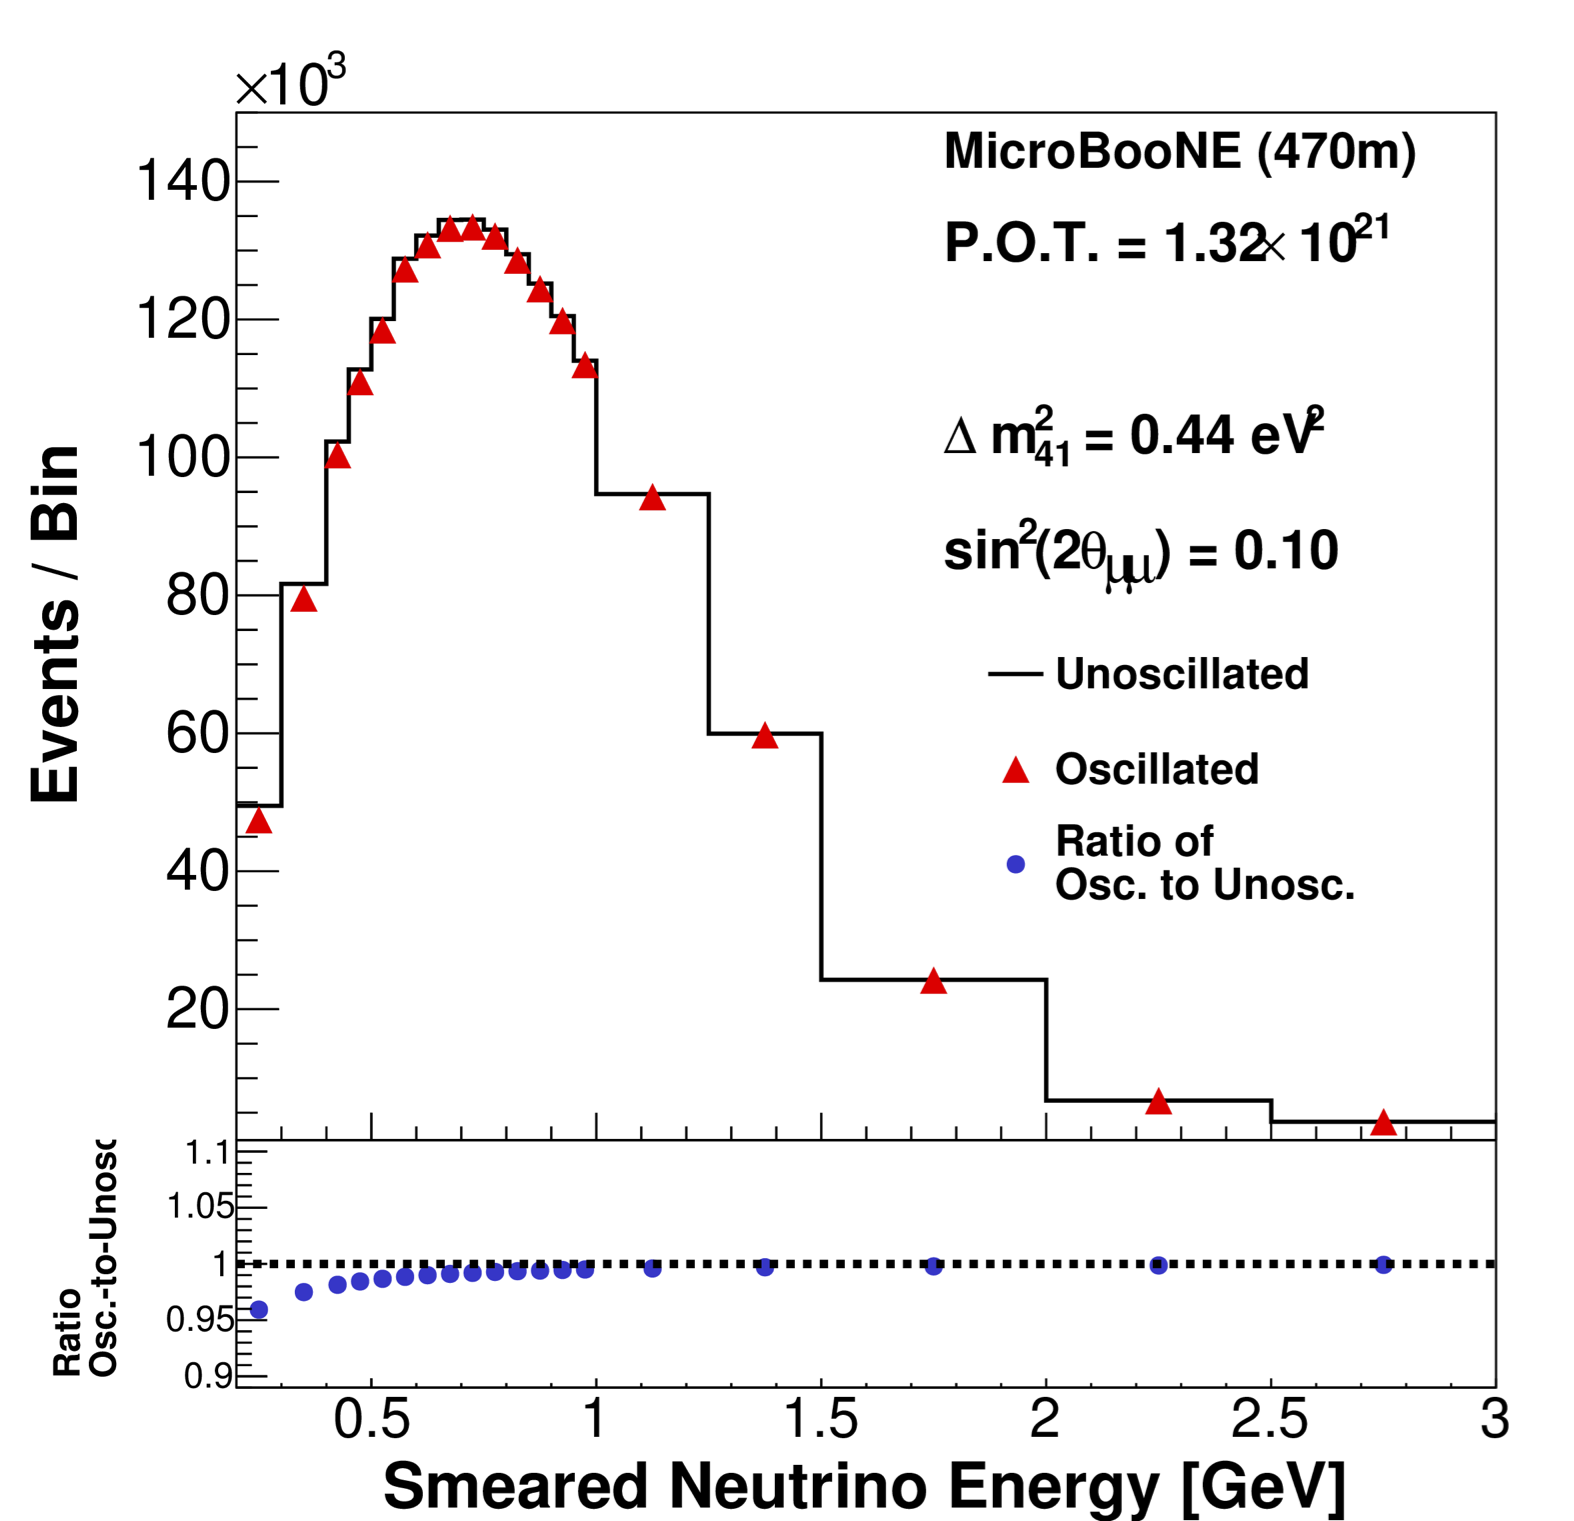
Numu_Evt_Dis_470m_44
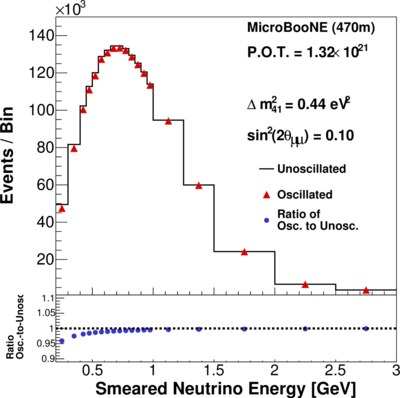
Numu_Evt_Dis_470m_44.png
Numu_Evt_Dis_470m_44_caption.txt
Examples of $\nu_{\mu}$ disappearance signals in MicroBooNE for $\Delta m^{2} = 0.44 \text{eV}^2$ with 13.2e20 protons on target.
Numu_dis_sensitivity
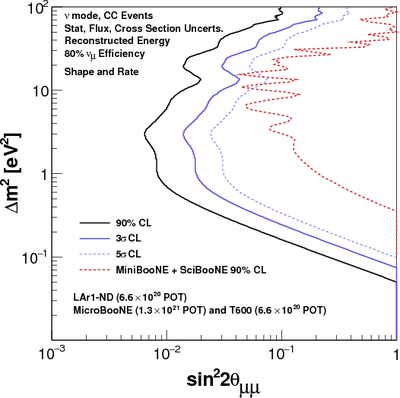
Numu_dis_sensitivity.pdf
Numu_dis_sensitivity_caption.txt
Sensitivity prediction for the SBN program to $\nu_{\mu} \rightarrow \nu_{x}$ oscillations including all backgrounds and systematic uncertainties described in the proposal. SBN can extend the search for muon neutrino disappearance an order of magnitude beyond the combined analysis of SciBooNE and MiniBooNE.
General cross section public plots and tables (#4331)
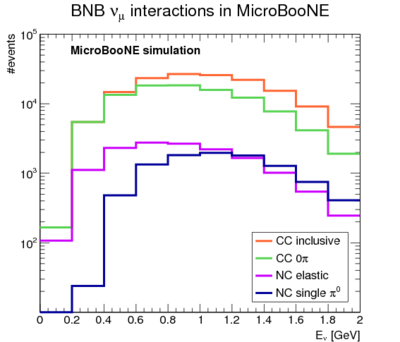
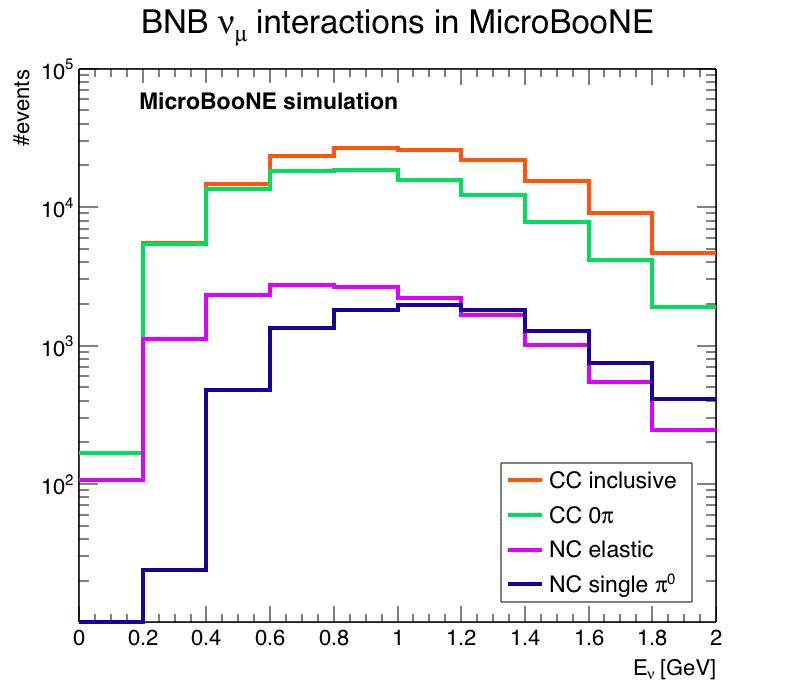
cFS
cFS.eps
cFS.png
cFS_caption.txt
Energy distribution of BNB muon neutrino event rates in MicroBooNE for different event signatures for an 87 ton active volume. Selection efficiencies are not considered.
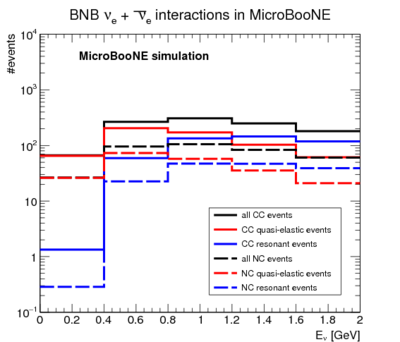
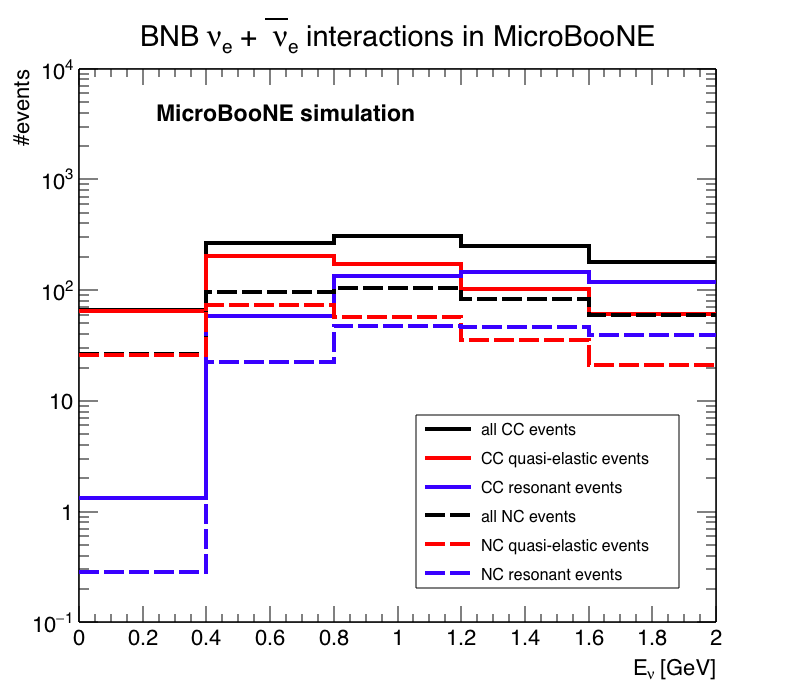
cnue
cnue.eps
cnue.png
cnue_caption.txt
Energy distribution of BNB electron and antielectron neutrino events in MicroBooNE for different interaction channels for an 87 ton active volume. Selection efficiencies are not considered. Separation between RES and DIS channels is based on a cut on the hadronic mass W < 2 GeV (RES) and W > 2 GeV (DIS) rather than GENIE interaction mode.
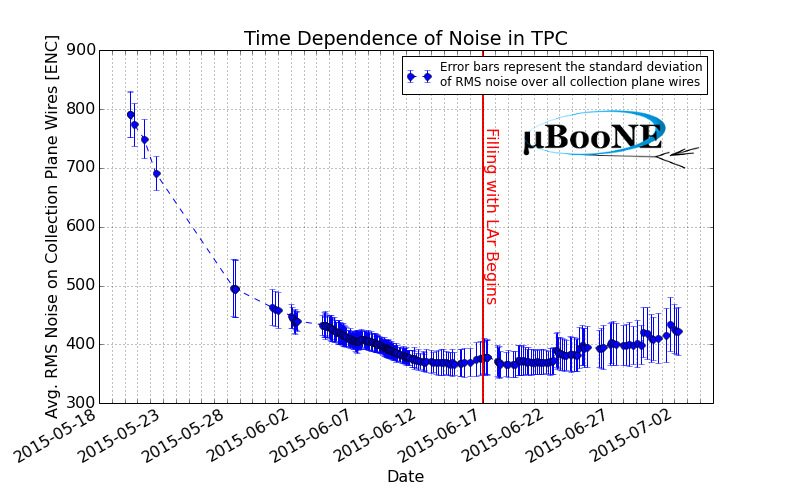
Noise Dependence on Temperature and LAr Fill Level in the uBooNE Time Projection Chamber (#4717)
noise_vs_time
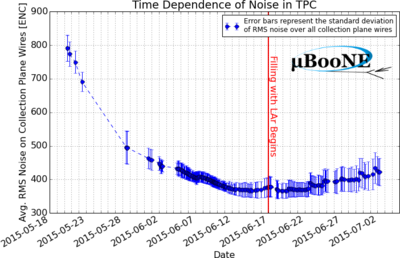
noise_vs_time.png
noise_vs_time_caption.txt
Noise measured on collection plane wires as a function of time. Each data point corresponds to the measured noise level for a given run. The times shown are the times at which each run was taken. For each run, a list of channels was selected such that 1) it was a collection plane wire, 2) it had noise values within a certain range. The average and standard deviation of the distribution of RMS noise values for channels passing the cut was calculated. Data points represent the average RMS, and error-bars show the standard deviation of these distributions. Error bars are meant to show how the change in temperature affects noise levels compared to the intrinsic variability of noise in the detector due to channel-to-channel gain variations. ENC values are measured in number of electrons by taking the ADC noise measured at a 14 mV/fC ASIC gain and multiplying it by [ 1.6E-4 (fC/e-) X 1.935 (ADC/mV) X 14 (mV/fC)]^-1. Noise values drop with the gasseous argon temperature. This is expected behavior due mainly to the properties of the CMOS ASIC chips. The red vertical line in this plot represents the time at which the LAr filling-process began. After this point noise levels begin to rise. This behavior is explained in the Tech-Note in DocDB 4717 in Sec. 5. Sporadicity of the data-points is due to irregular run-taking patterns in the very early weeks of the commissioning phase. Noise levels fluctuate slightly upwards in early and mid June. This is because the cryostat cooling was temporarily interrupted for a brief period, allowing the temperature, and thus the noise values, to rise.
Approved Plots at Sept. 4th Plot Approval Meeting (#4787)
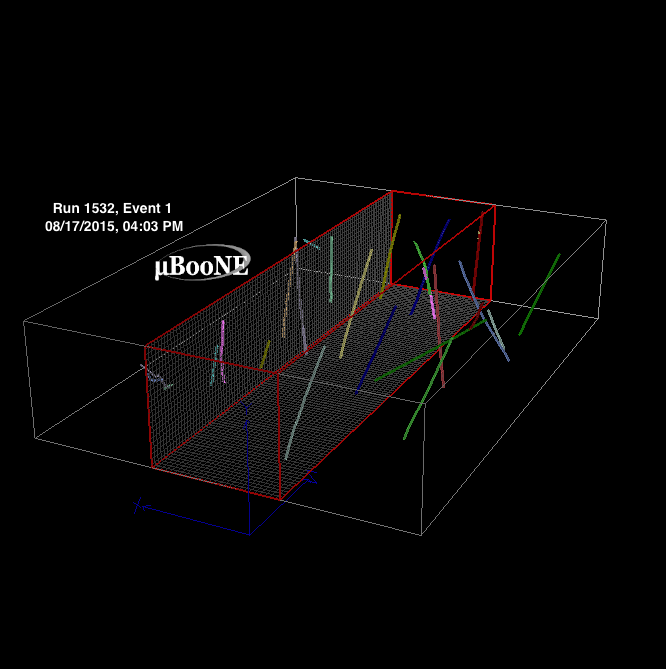
R1532E1_black_grid_axis
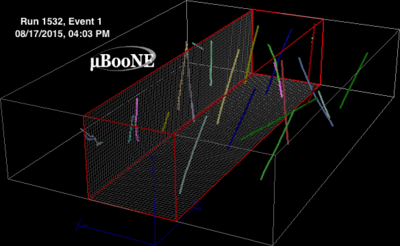
R1532E1_black_grid_axis.png
R1532E1_black_grid_axis_caption.txt
A snapshot from LArSoft based 3D event display showing cosmic tracks entering the MicroBooNE detector. The three boxes show the full readout window of the MicroBooNE detector which corresponds to 4.8 ms or equivalently the total effective drift volume for running at full field strength (-128 kV to cathode or 500 V/cm). The red highlighted box shows the physical volume of the TPC. The Colored lines shown in the boxes are 3D reconstructed tracks, different colors represent different tracks. Tracks are drawn along with their trajectory points. The data shown corresponds to cosmic run 1532, event 1 taken on 17th of August, 2015 at 4:03 PM at -70kV (or equivalently 273 V/cm) Electric field.